
Maps & Research
In the summer of 2020, a groundbreaking collaborative of philanthropic stakeholders and researchers--representing 25 foundations, public agencies and some private sector entities--formed and voluntarily shared data about how investments have been shifting to respond to the pandemic and what more needs to be done. This data, presented in visual maps, illustrates how COVID's devastating impact exacerbated the racial and health inequities that have been in place for decades. These maps also show how inequitable policies and lack of investment have fueled the pandemic's impact on BIPOC communities. We can use this information across sectors to rethink our investments, be equipped to advocate for change and work together towards thriving and stronger communities.
The maps created by the Mapping COVID-19 Recovery partnership are meant to be shared widely and are available for public use.
Our research maps show:
(Jump to section)
The Unequal Outcomes of COVID-19 (and introducing the Study Area)
Overview:
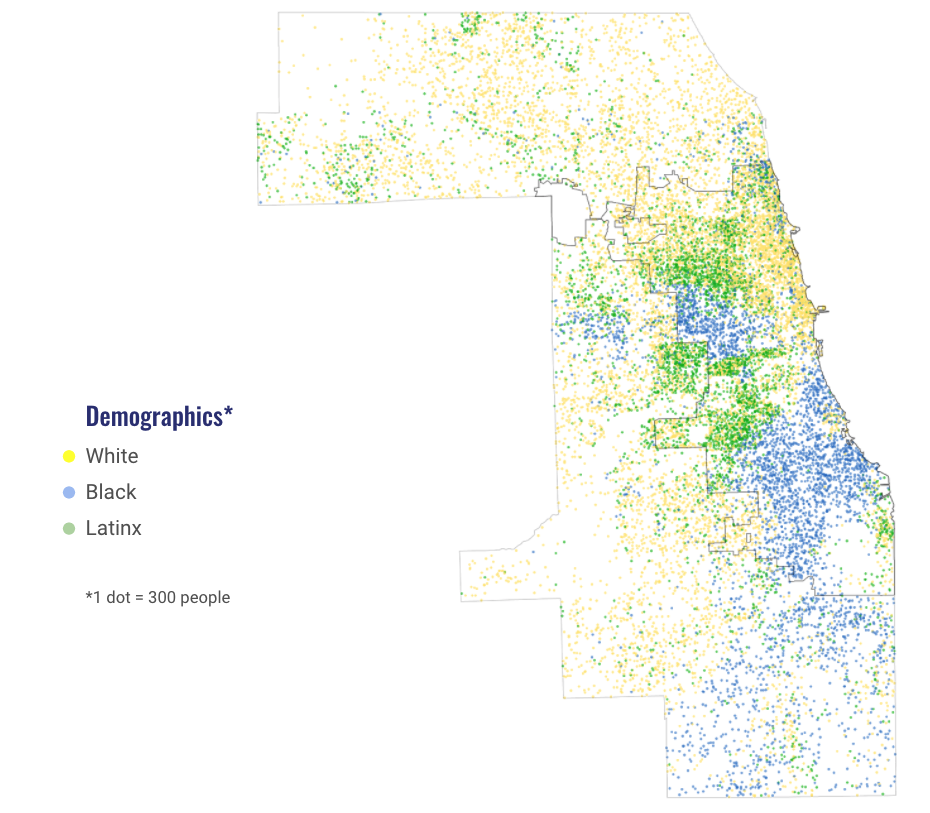
Understanding Cook County’s Demographics
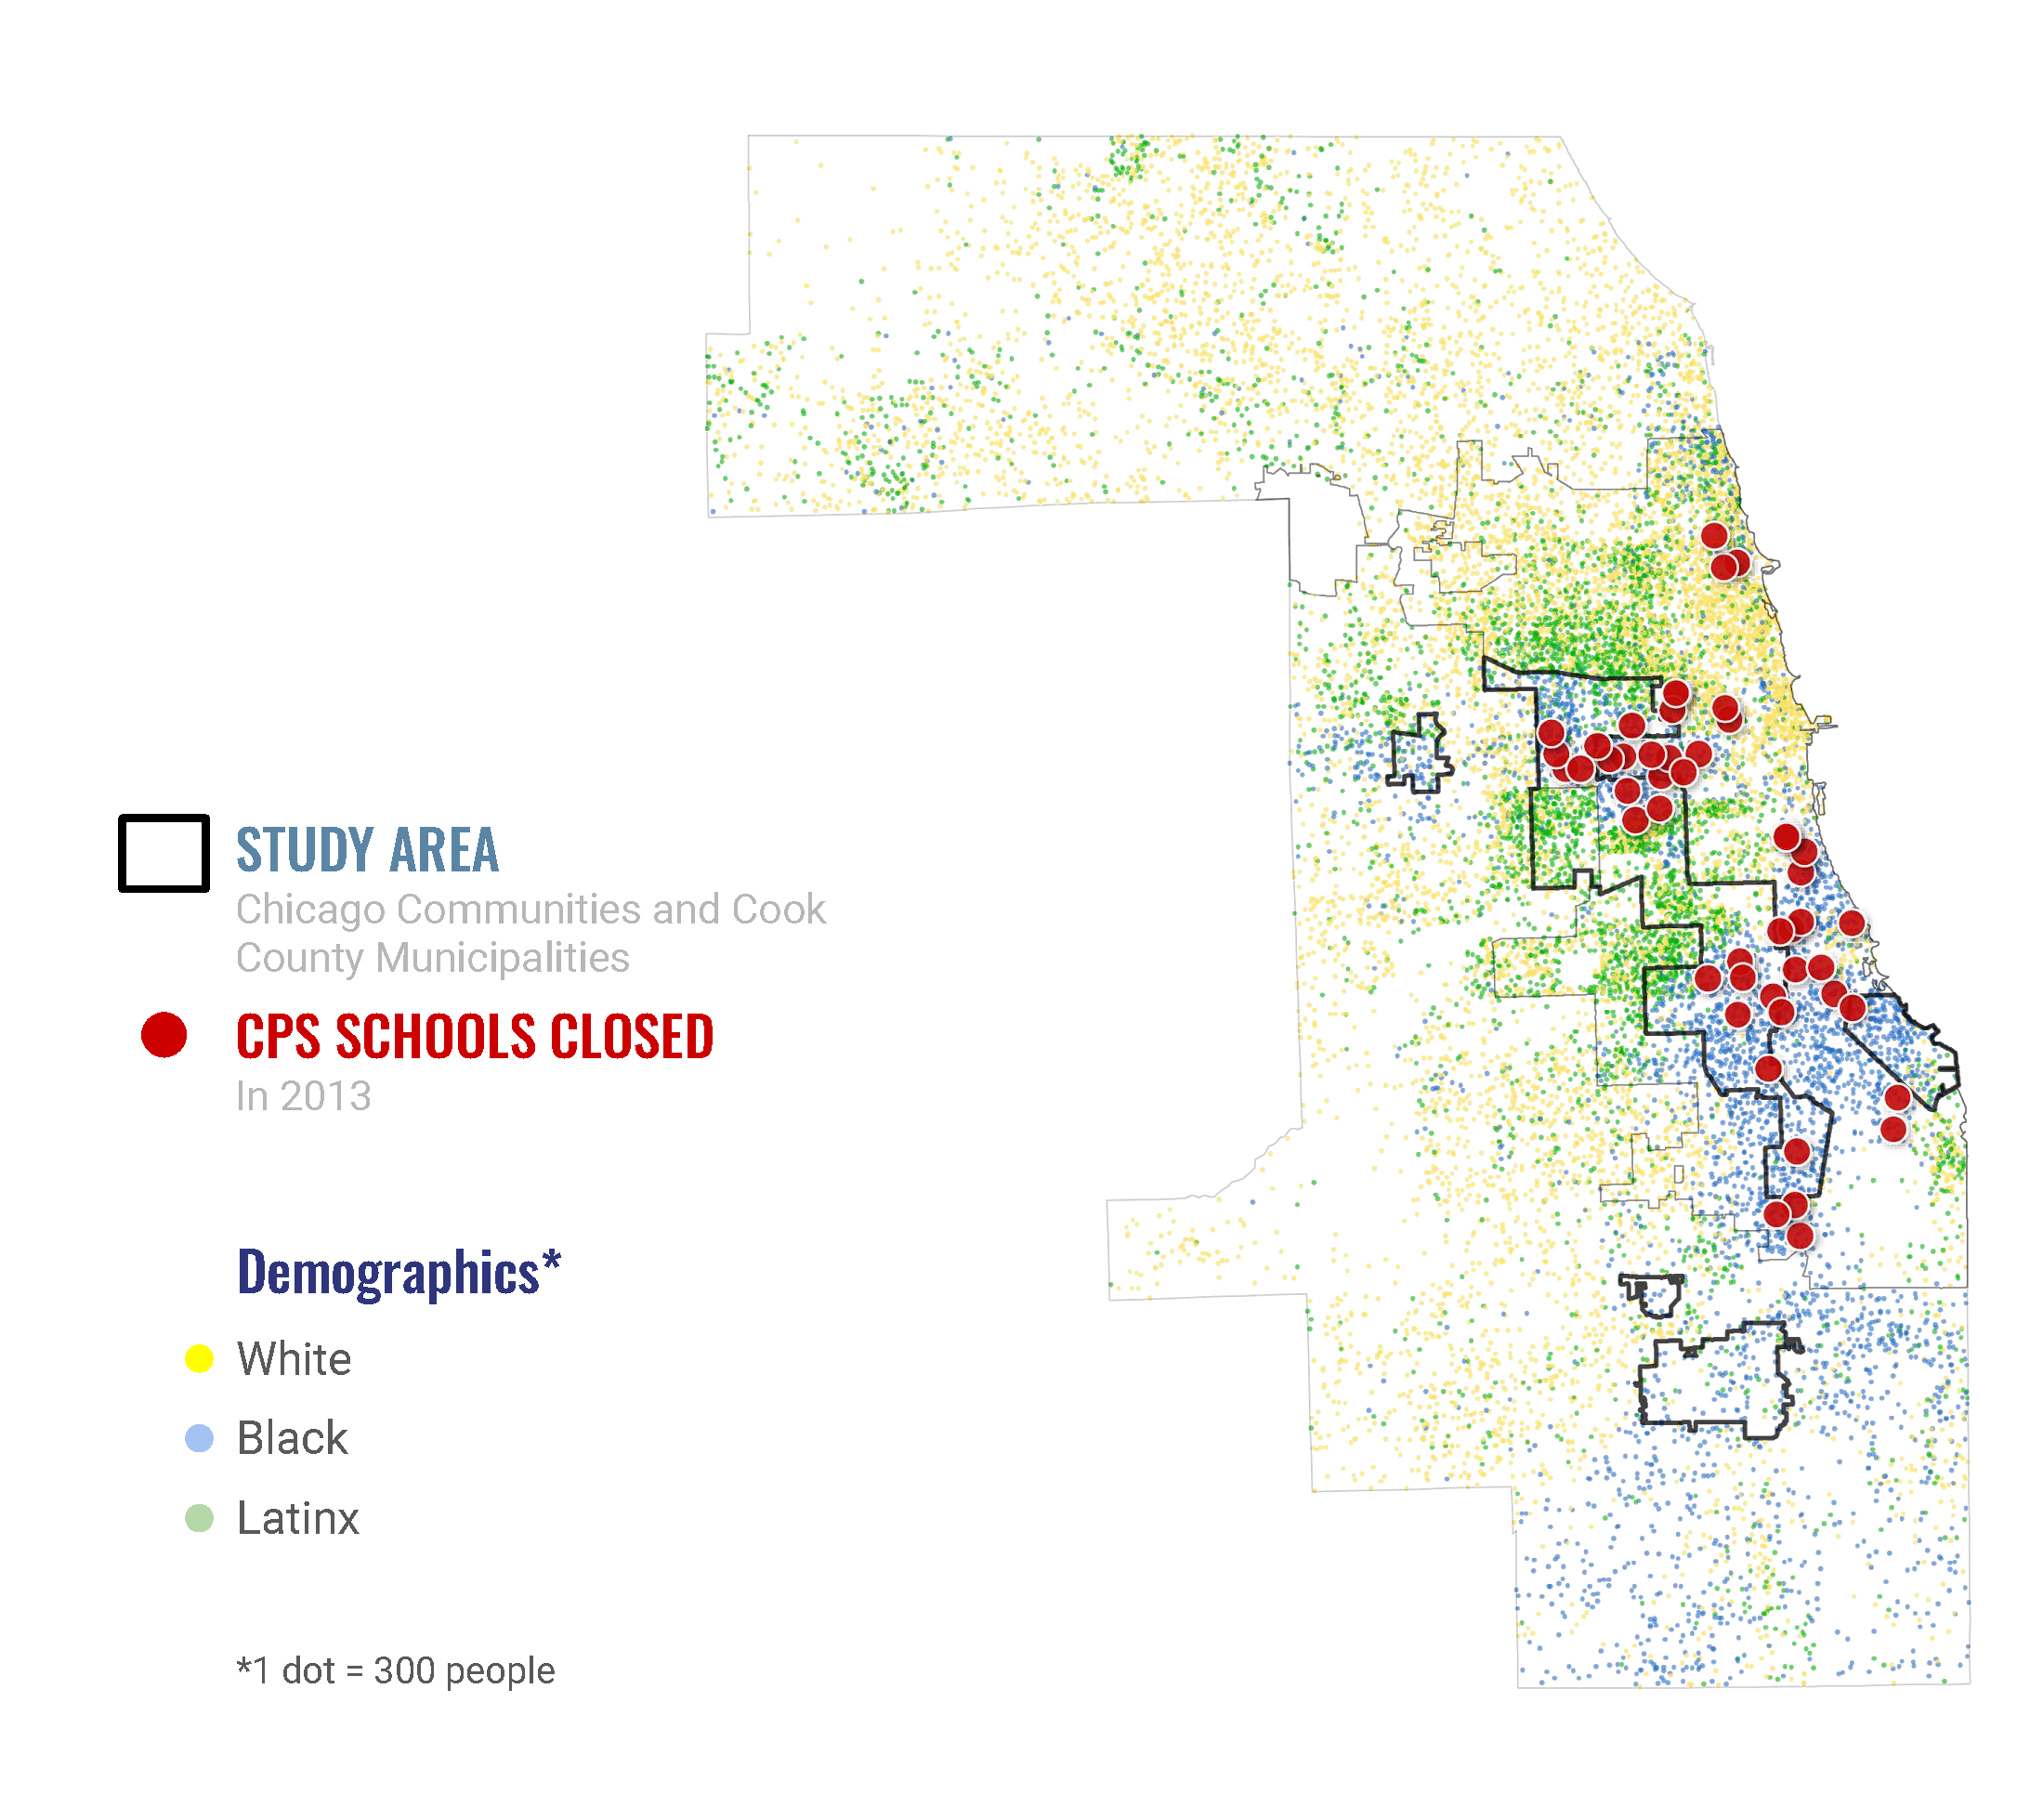
Cook County is highly segregated, with Black families (blue) clustered on the West and South Sides of Chicago and suburban Cook, and Latinx families (green) clustered on the Southwest, Southeast, and Northwest sides of Chicago, and Northwestern Cook.
Where We Are:
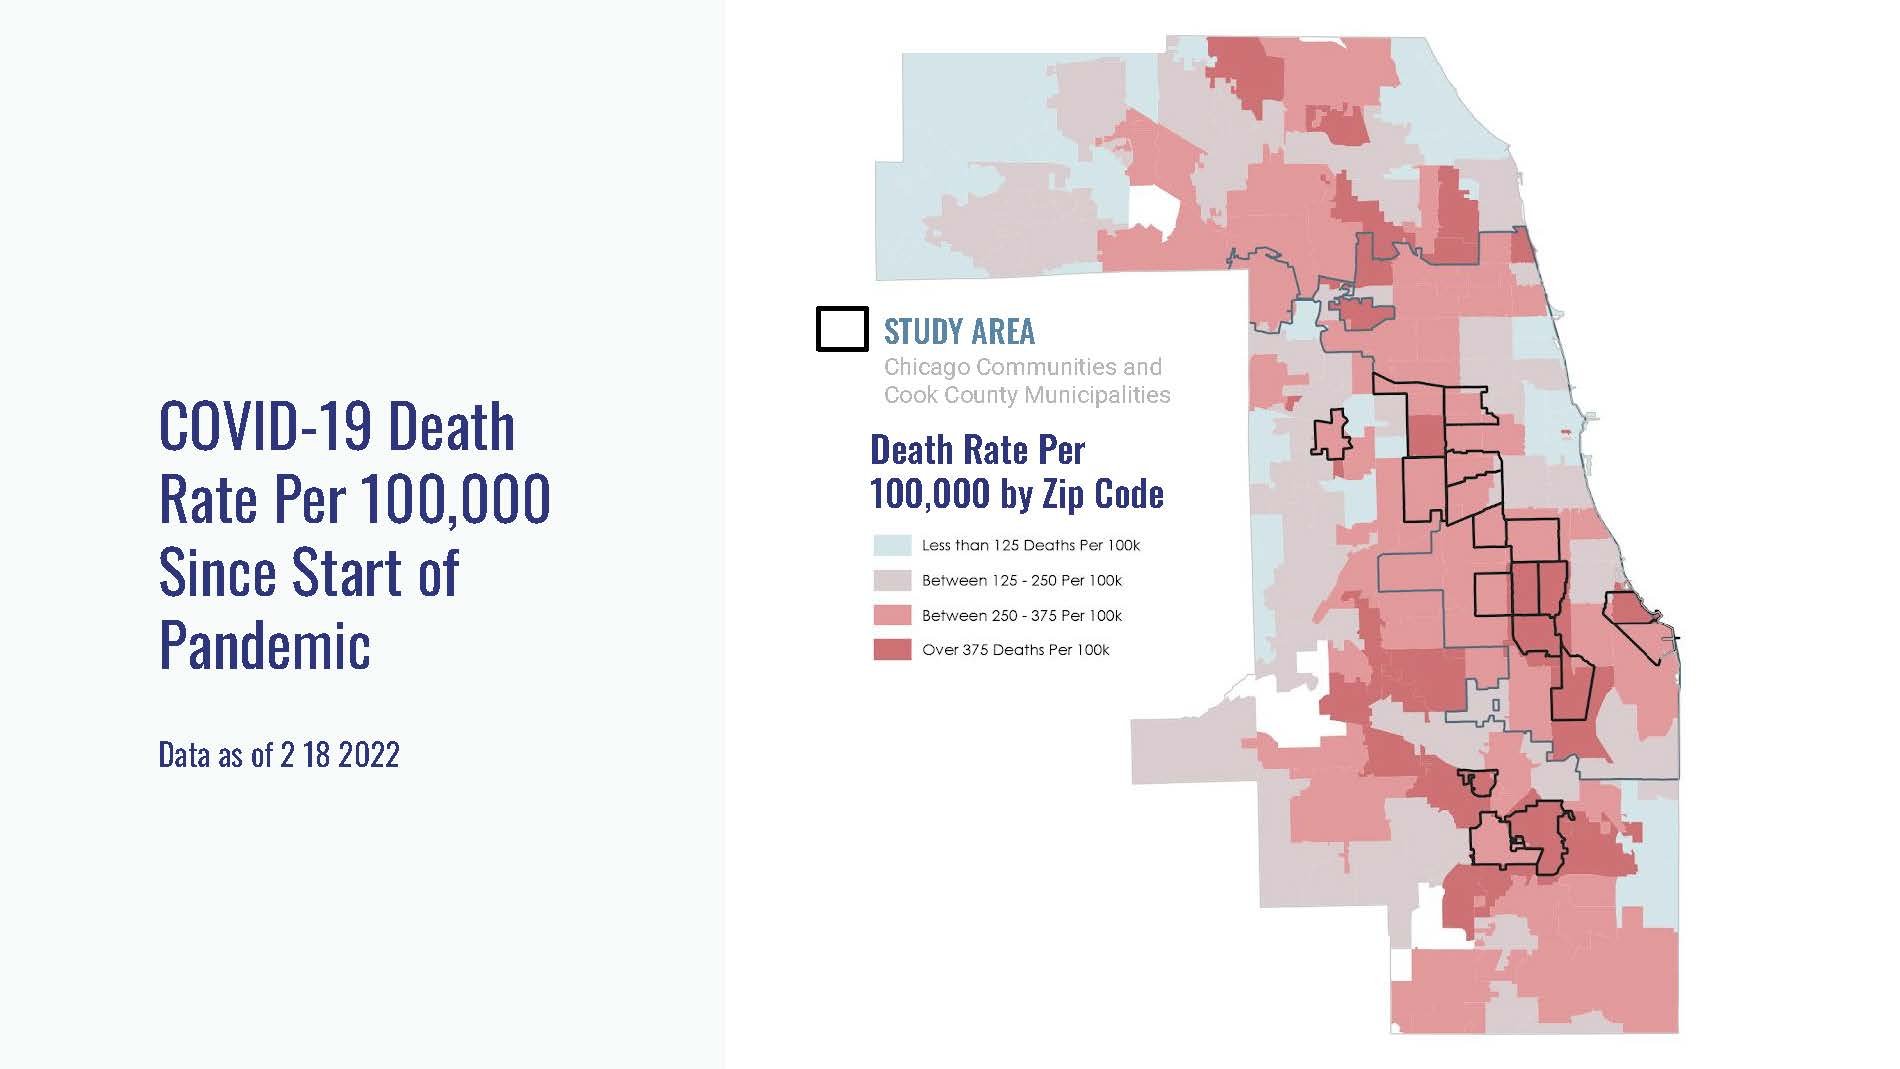
COVID Cases, Positivity Rate, and Deaths Have Disproportionately Impacted Black and Brown People
01
THE UNEQUAL OUTCOMES OF COVID ARE NO ACCIDENT.

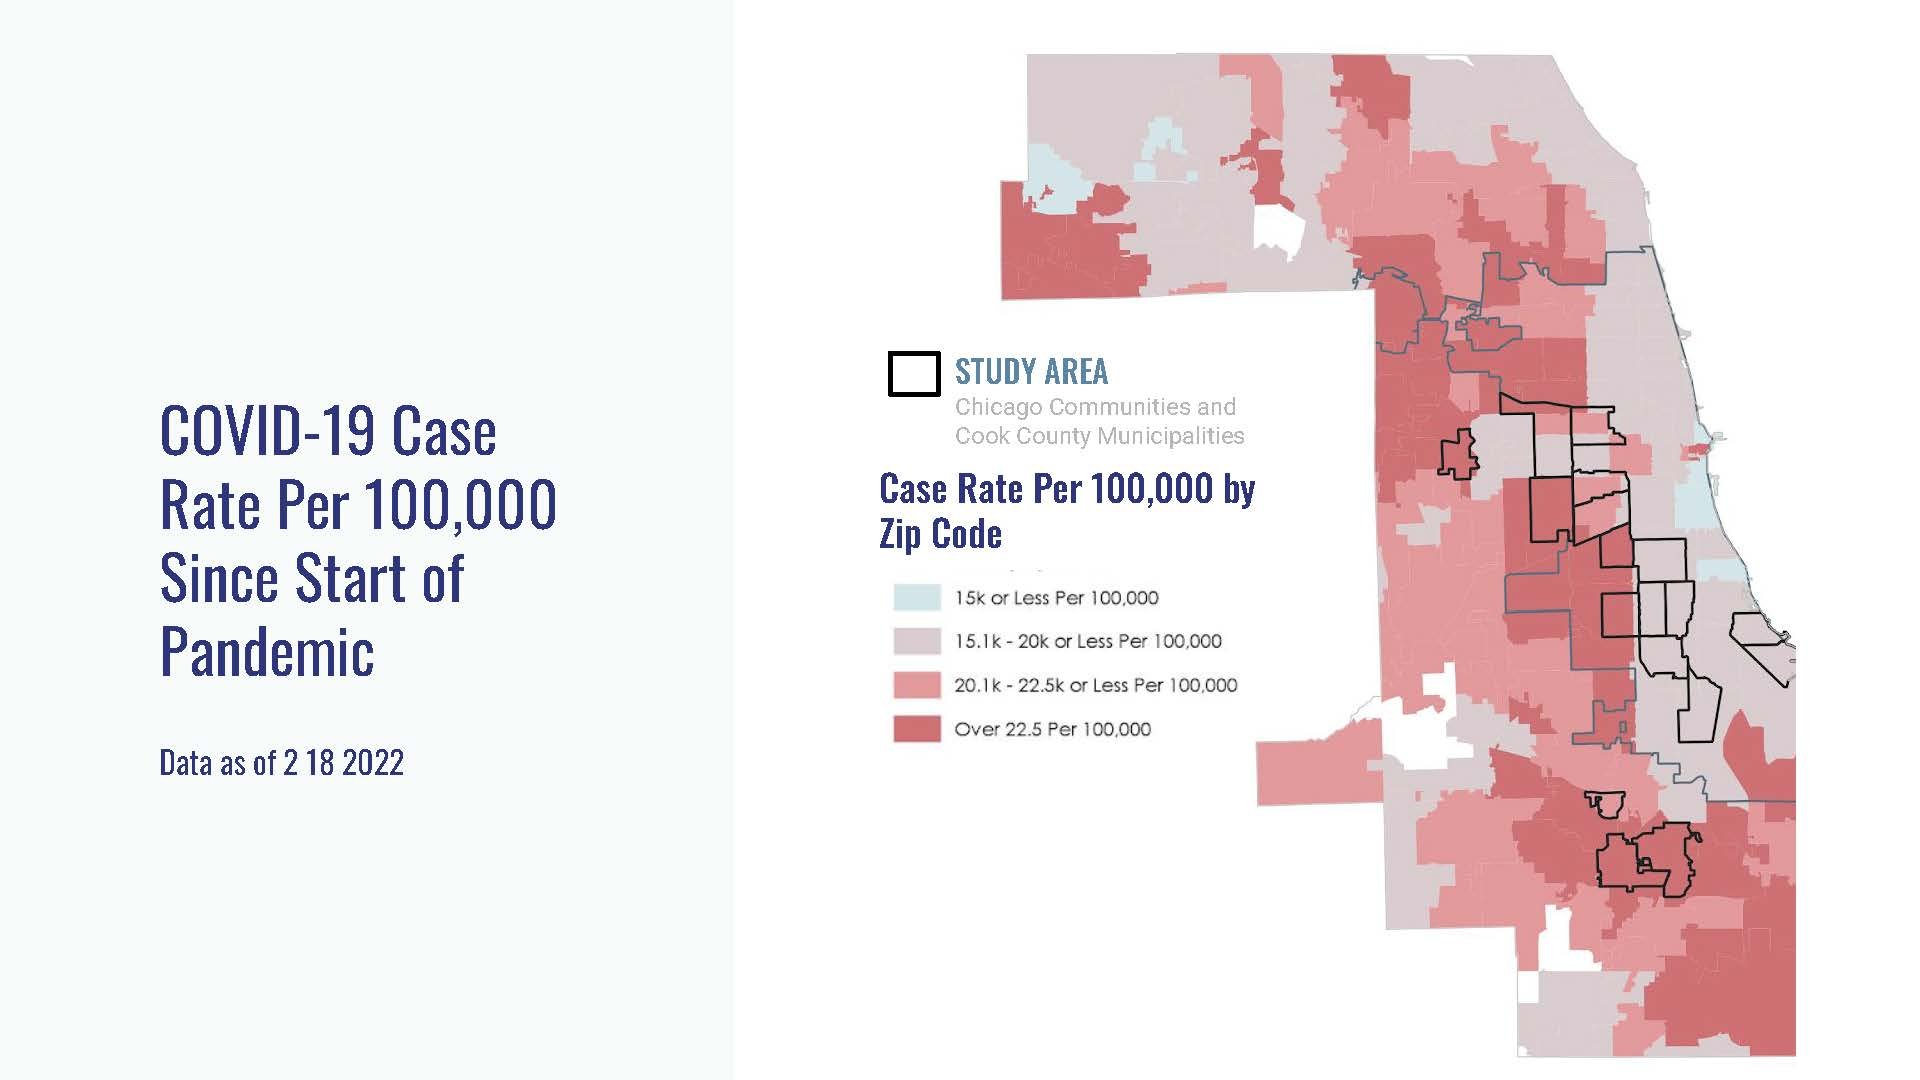
Black and Latinx communities have been hit disproportionately hard by the COVID pandemic. Black people have been dying at the highest rates, and Latinx people have been infected with COVID at the highest levels. This did not happen by chance.
Decades of inequitable public policies and investment patterns created a tinderbox of vulnerability, which was ignited by COVID. Generations ago, federal policies steered mortgage lending away from Black and Brown communities, in Chicago and cities across the country. Red lines drawn on maps based on race made homeownership attainable only for White families and created the patterns of segregation we still see today. Even long after such discriminatory practices were banned, private investment still follows this pattern, and flows to White neighborhoods at much higher rates.
In Black and Brown neighborhoods we have seen a different type of investment pattern—incarceration, which systematically removes people from communities and disrupts families. These investment patterns helped created economic and health vulnerabilities—a tinderbox. If we don’t work to change the conditions that created this tinderbox, we risk having the same unequal outcomes the next time we have a crisis.
↓

Introducing the Study Area: Chicago Communities and Cook County Municipalities

Redlining of Black Neighborhoods
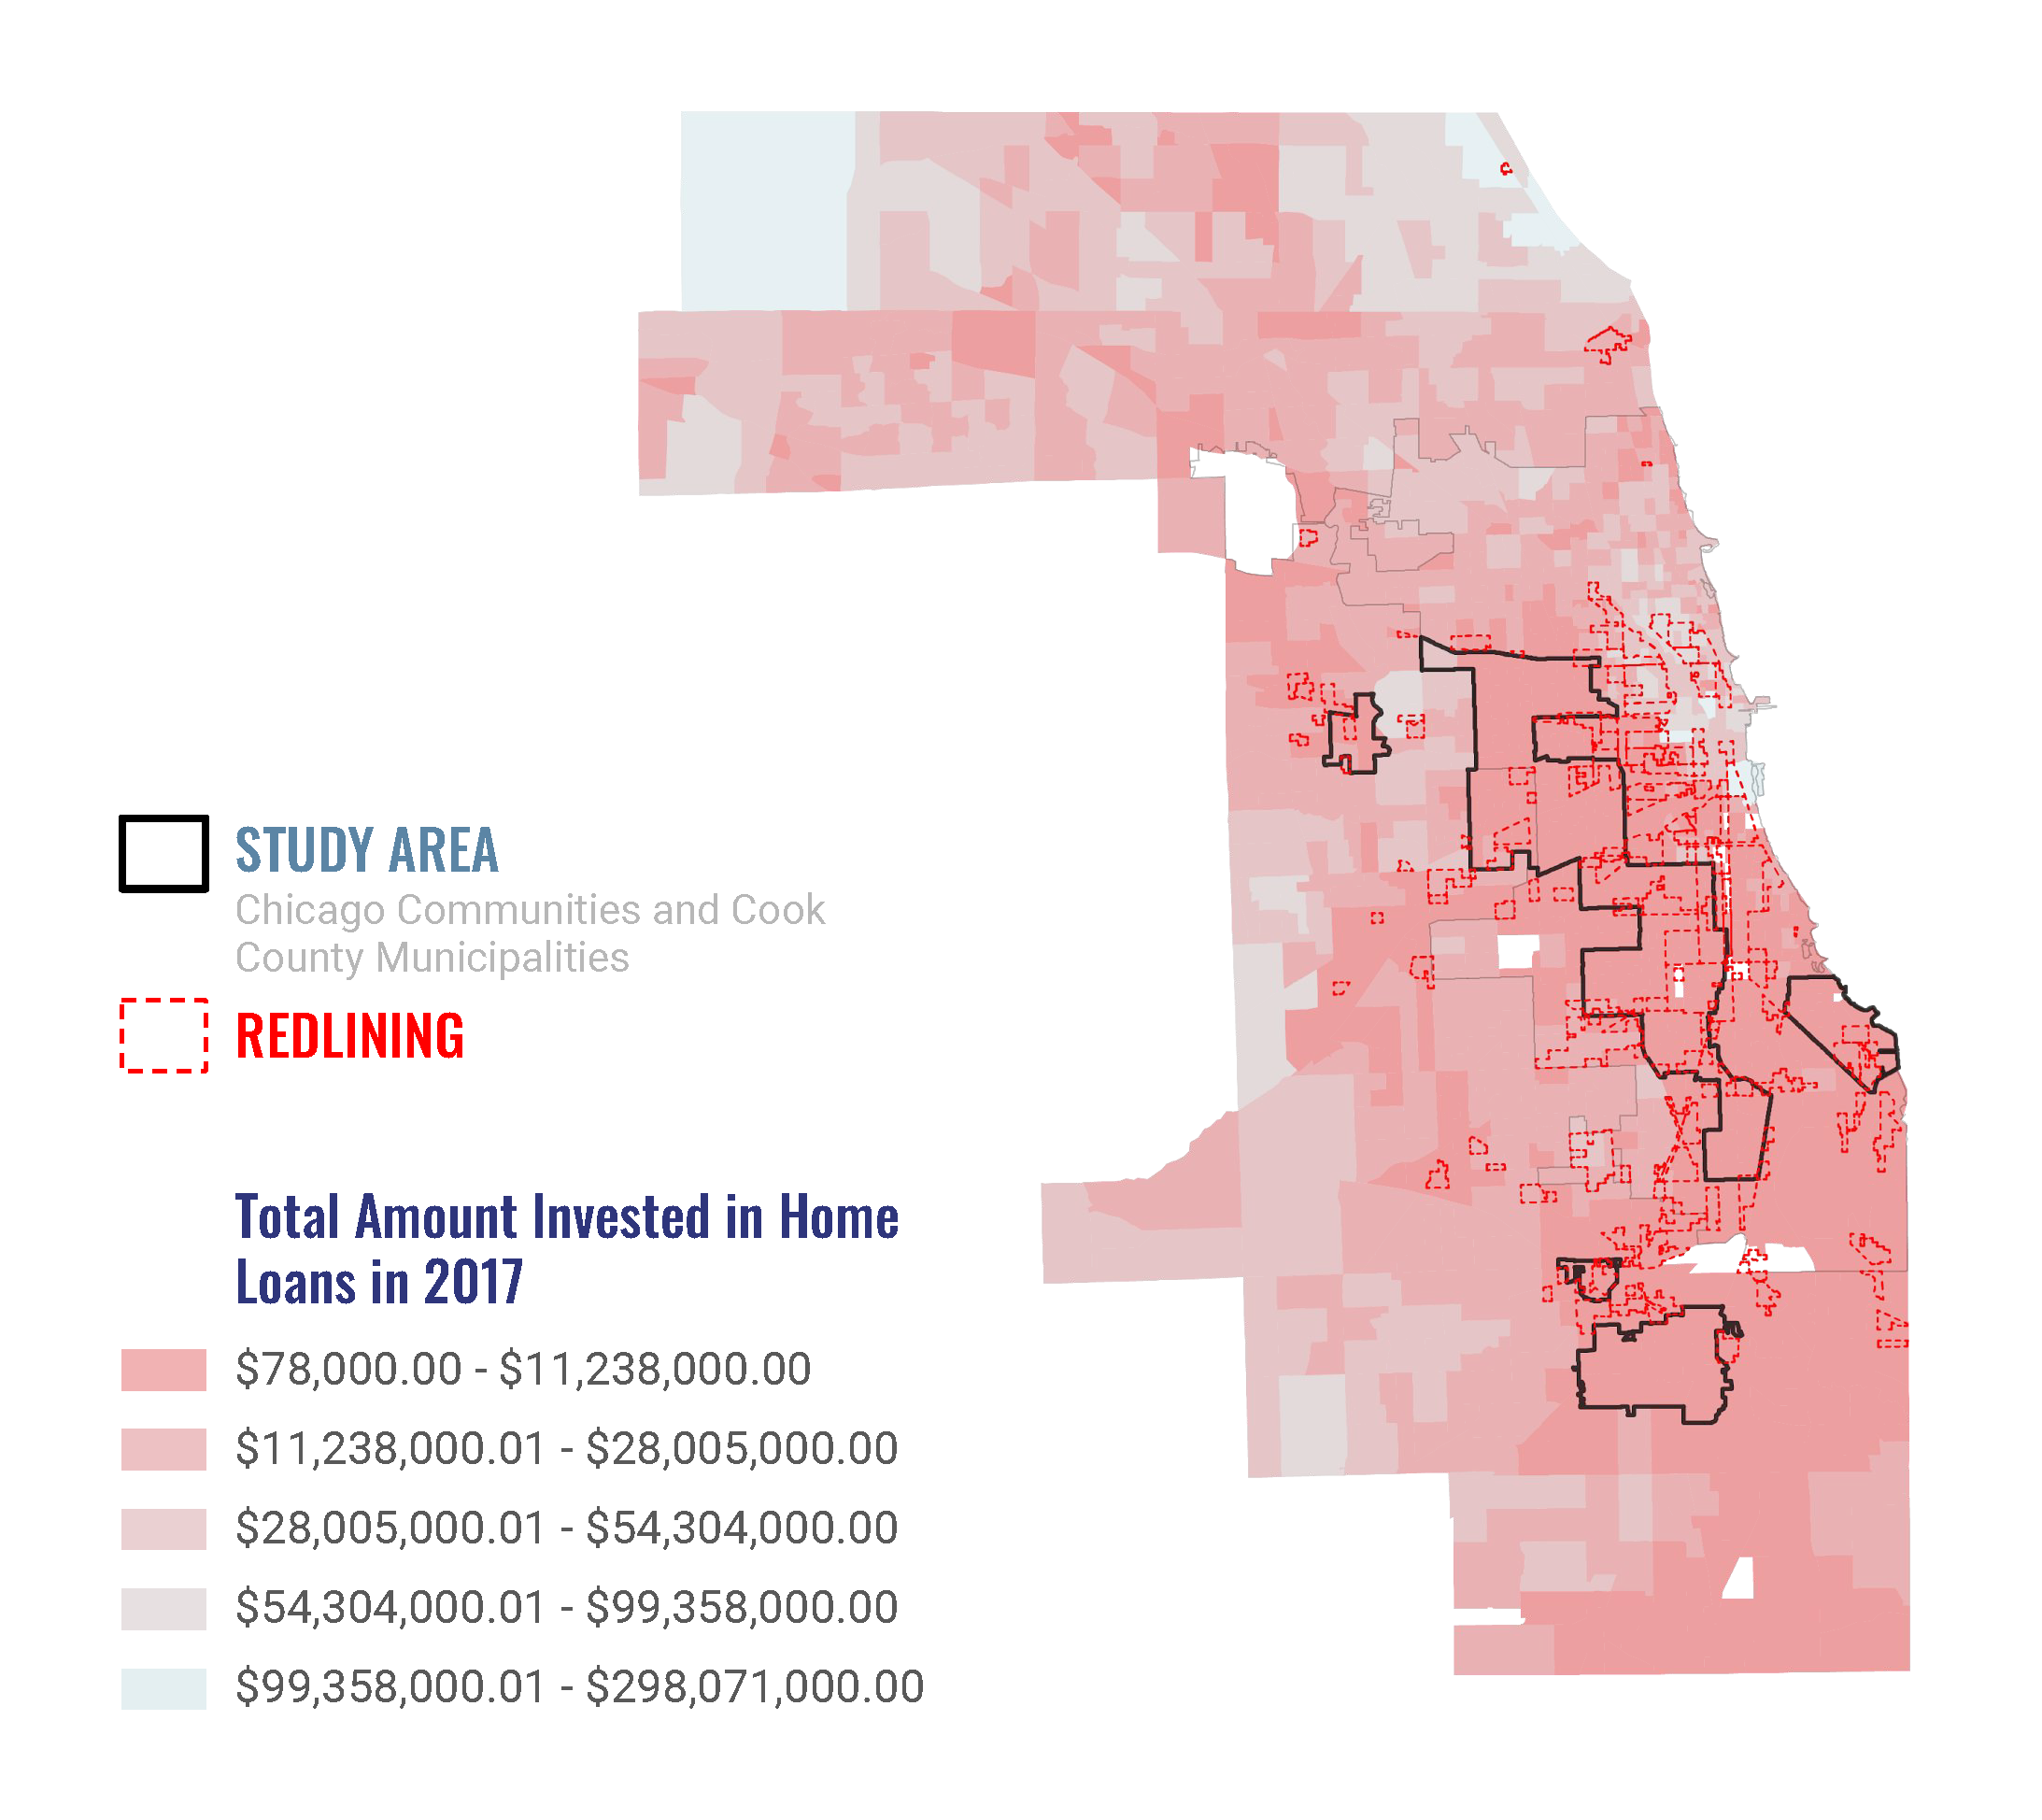
Private Investment Still Avoids Black Areas
Policies Set the Stage for COVID-19 Disparities
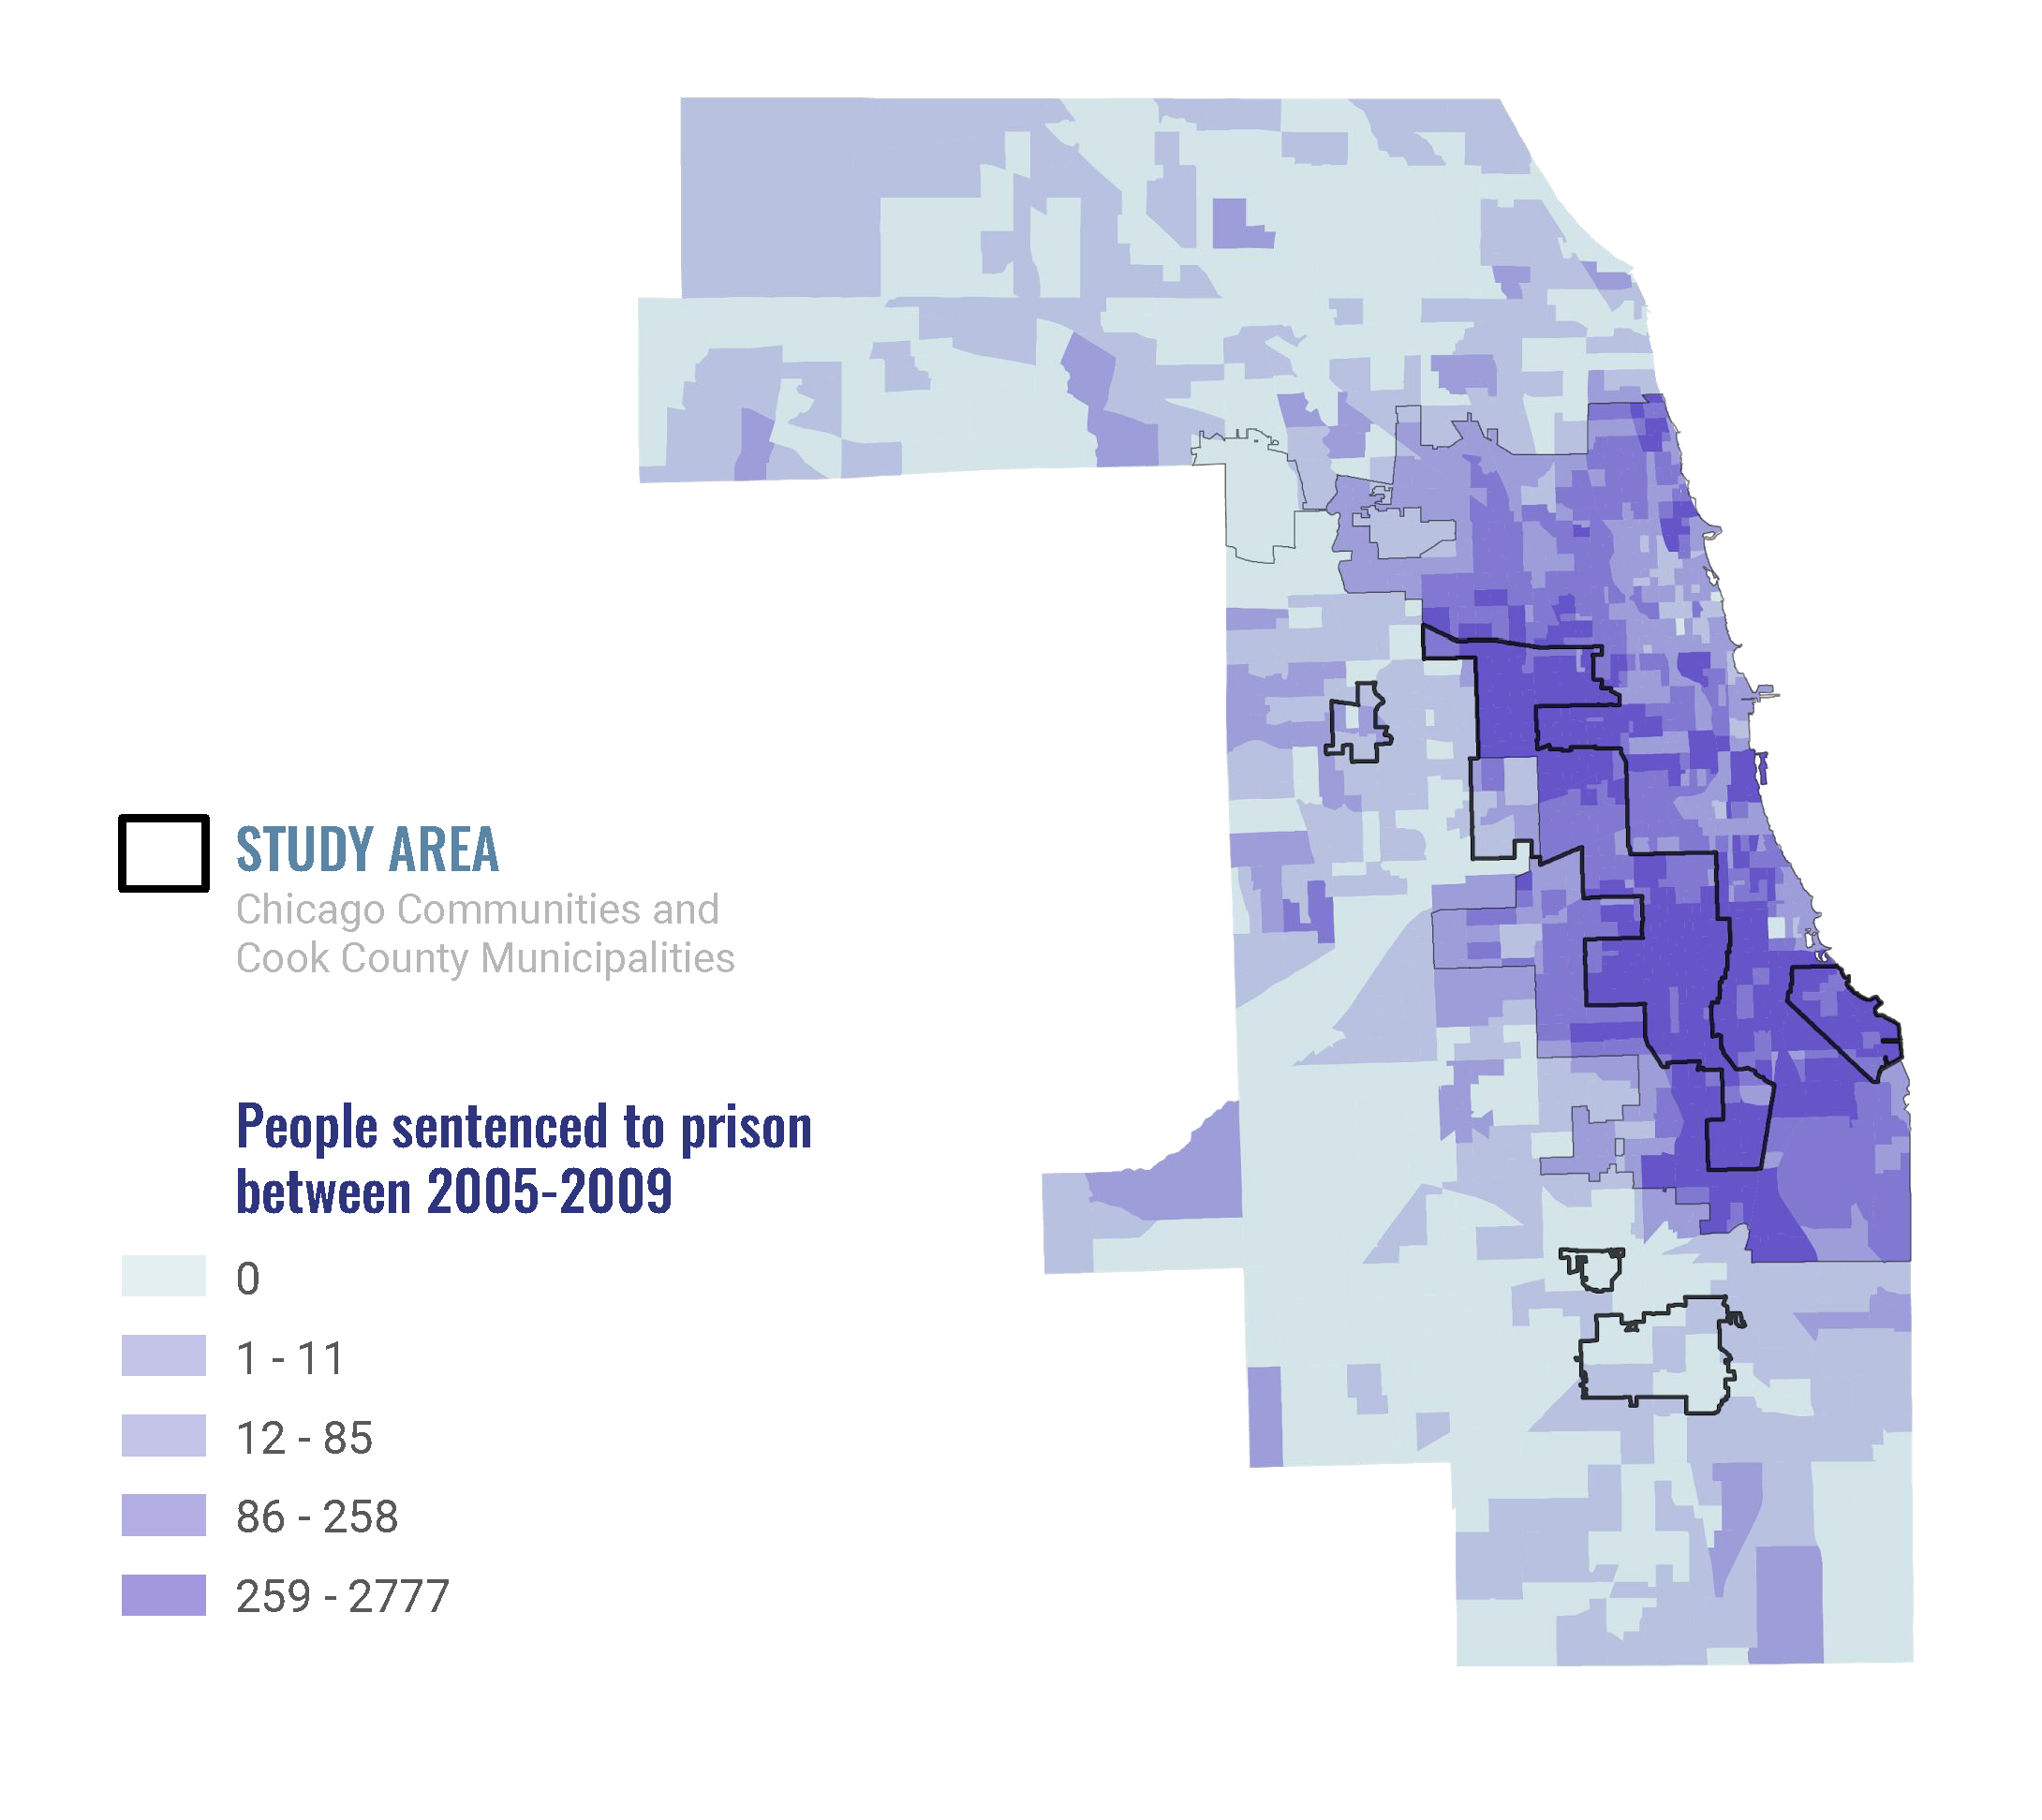
Heavy Public Investments in Incarceration
02
Inequitable Economic Policies Have Created the Pre-Existing Health Conditions of COVID.
The legacy of these racist policies has resulted in White accumulation of wealth and economic stress for people of color. Income and wealth are some of the most significant determinants of health and well-being. Those who experience poverty and financial insecurity also experience health vulnerabilities such as diabetes and high blood pressure, two pre-existing conditions that have made COVID infections even more deadly.
Black and Brown populations are more likely to be essential workers who don’t have the luxury of working from home and experience the greatest challenges in accessing health care and other health resources. These structural patterns are a continuation of the tinderbox that COVID ignited.
↓

Economic Vulnerability Means Health Vulnerability - % with Diabetes
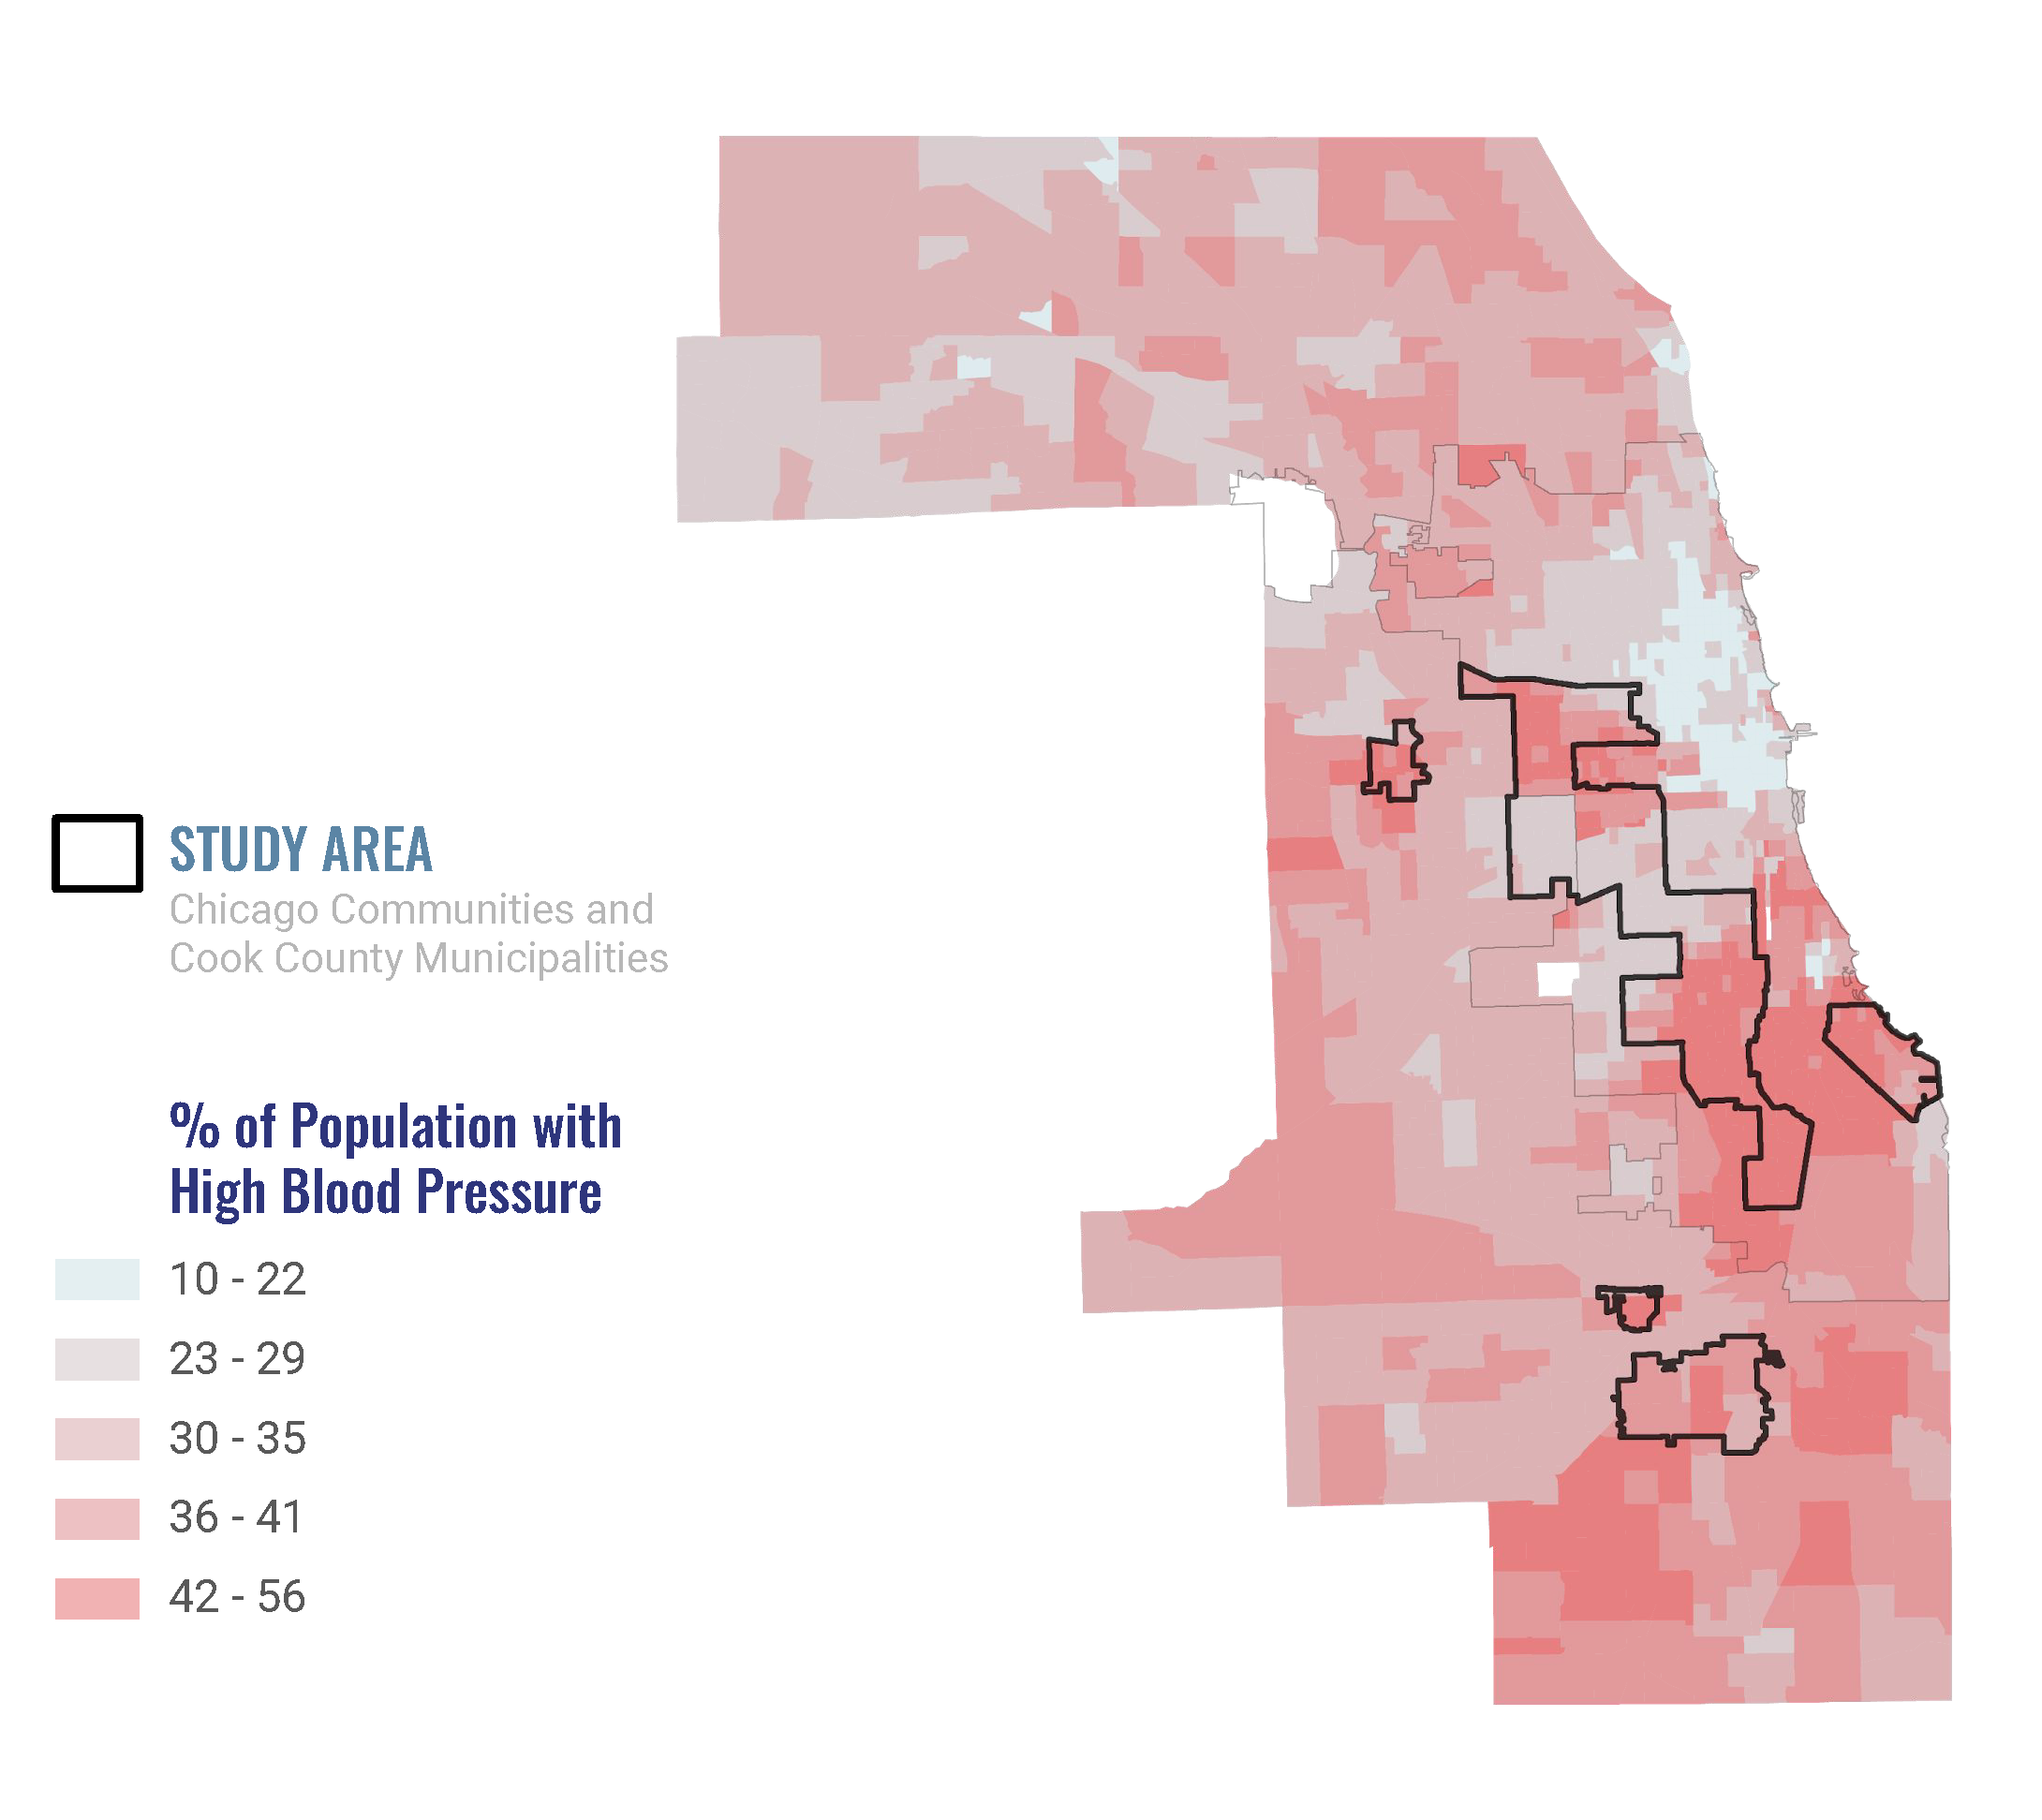
Economic Vulnerability Means Health Vulnerability - % with High Blood Pressure
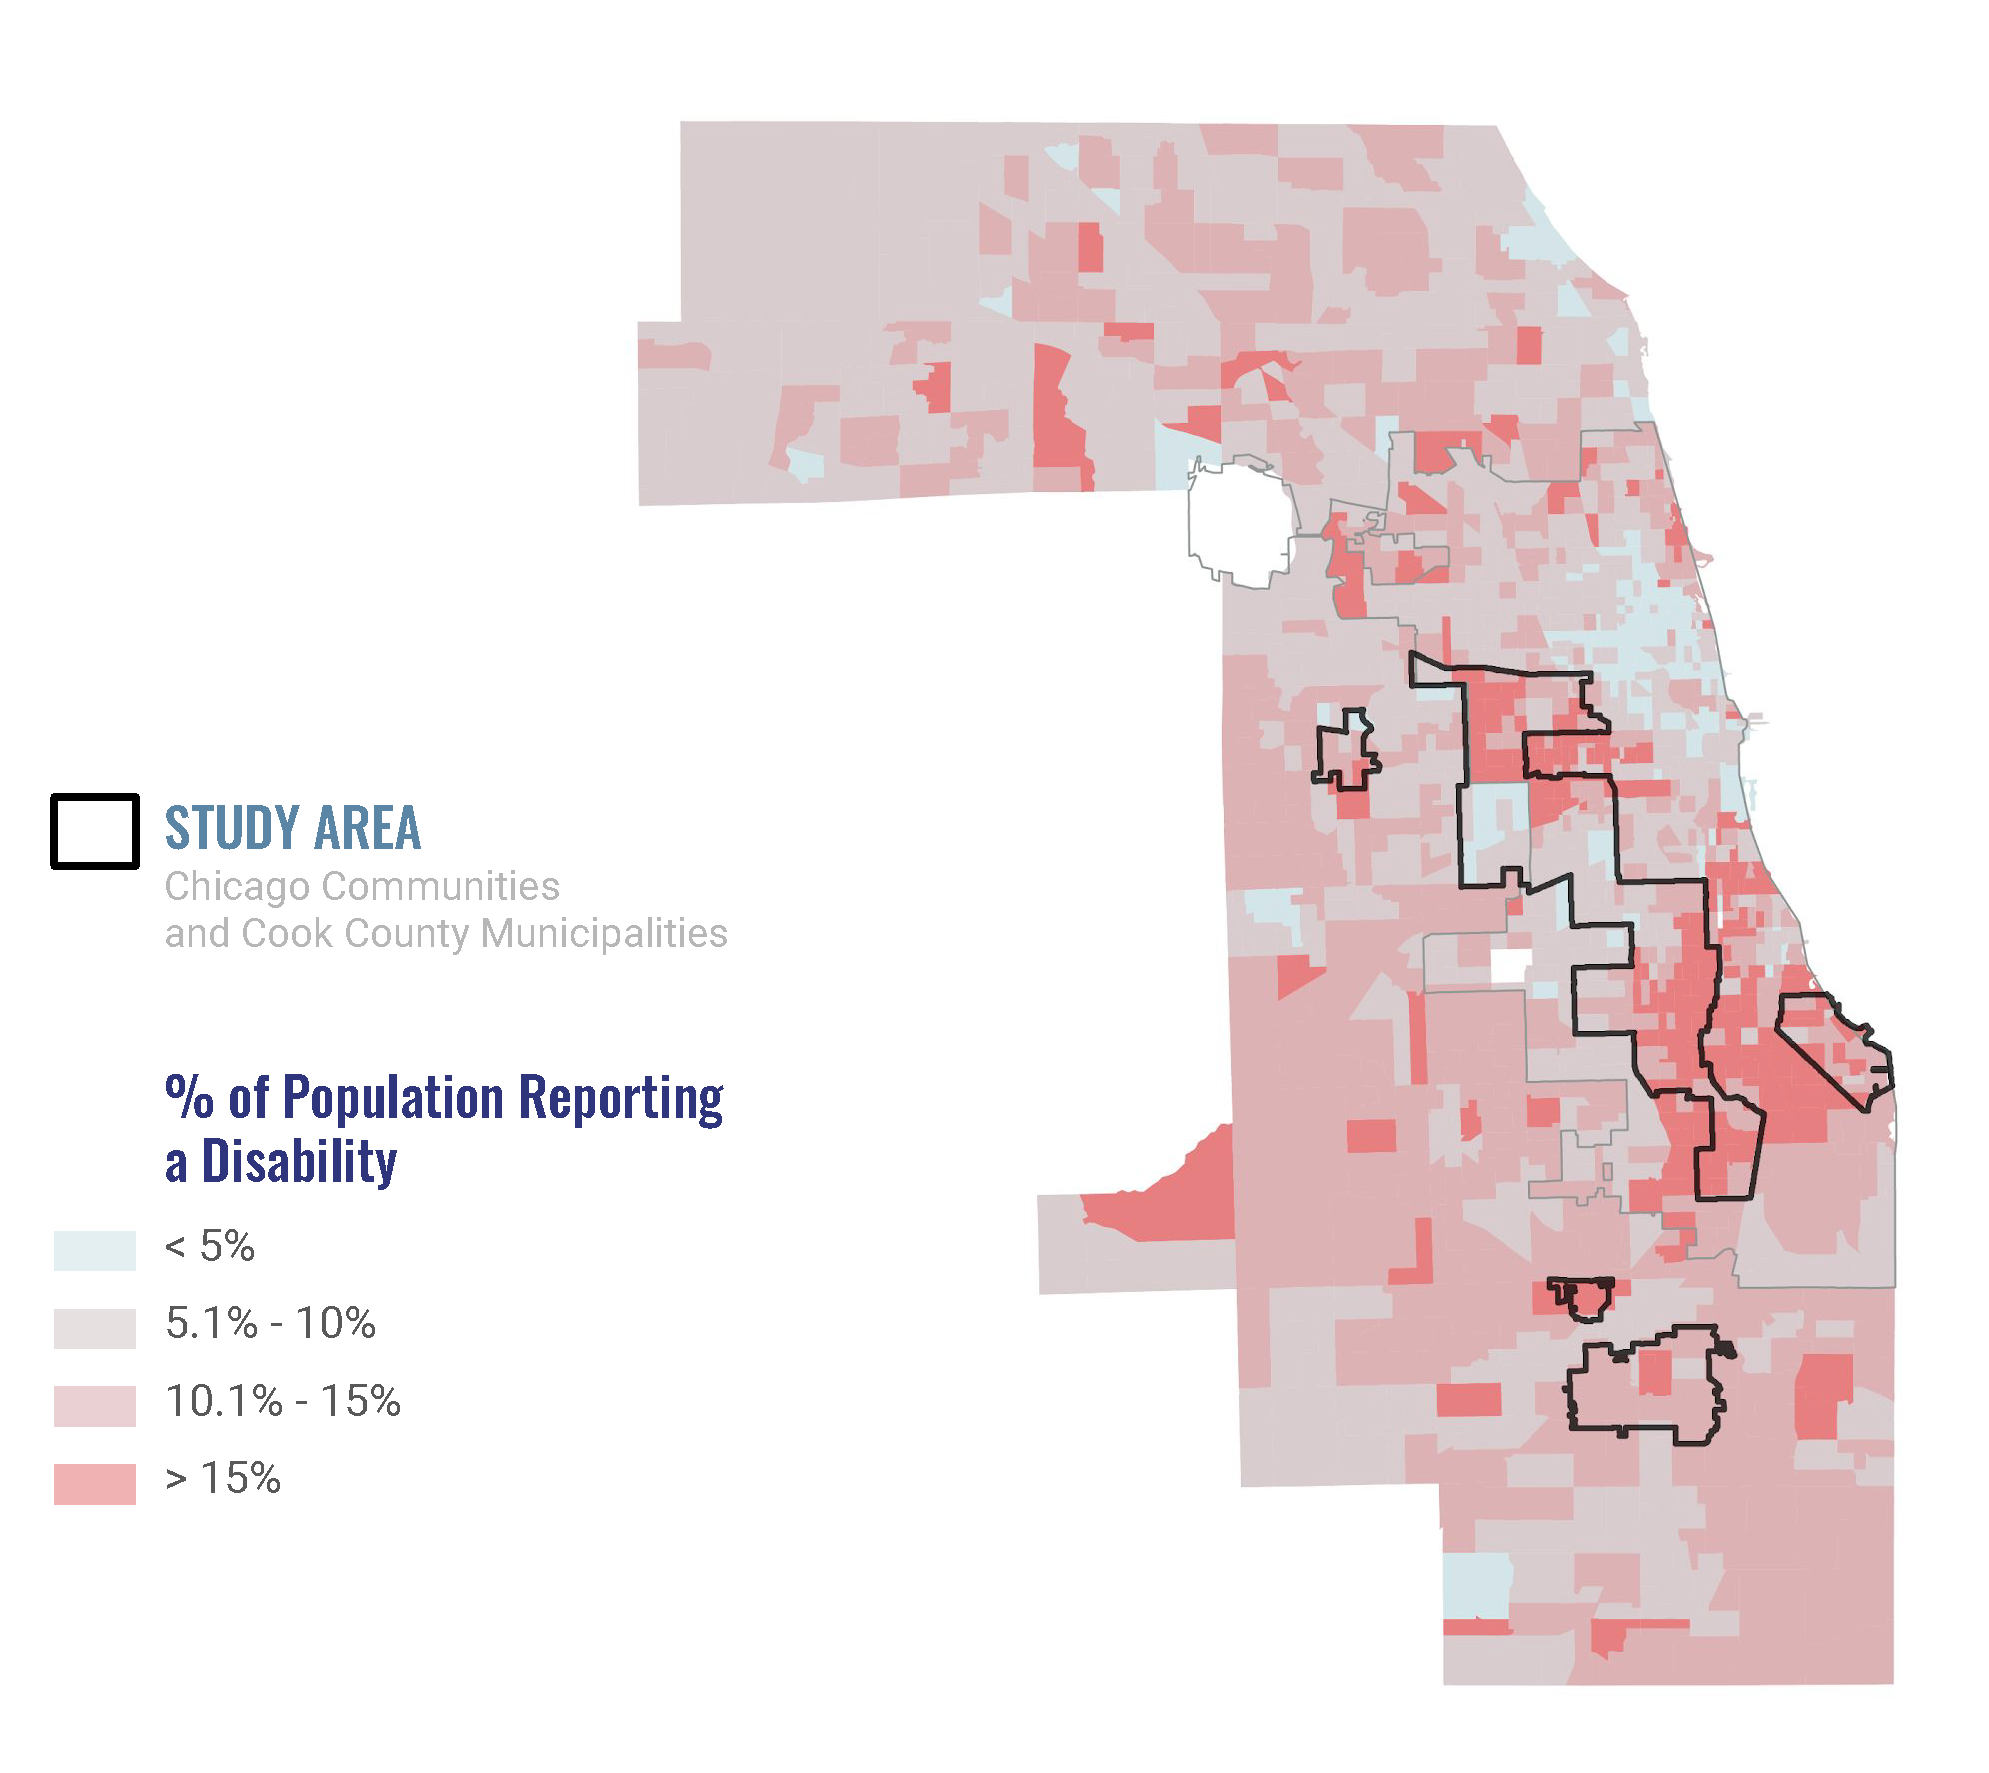
Concentration of Populations Reporting Disabilities

COVID-19 Ignites The Tinder Box
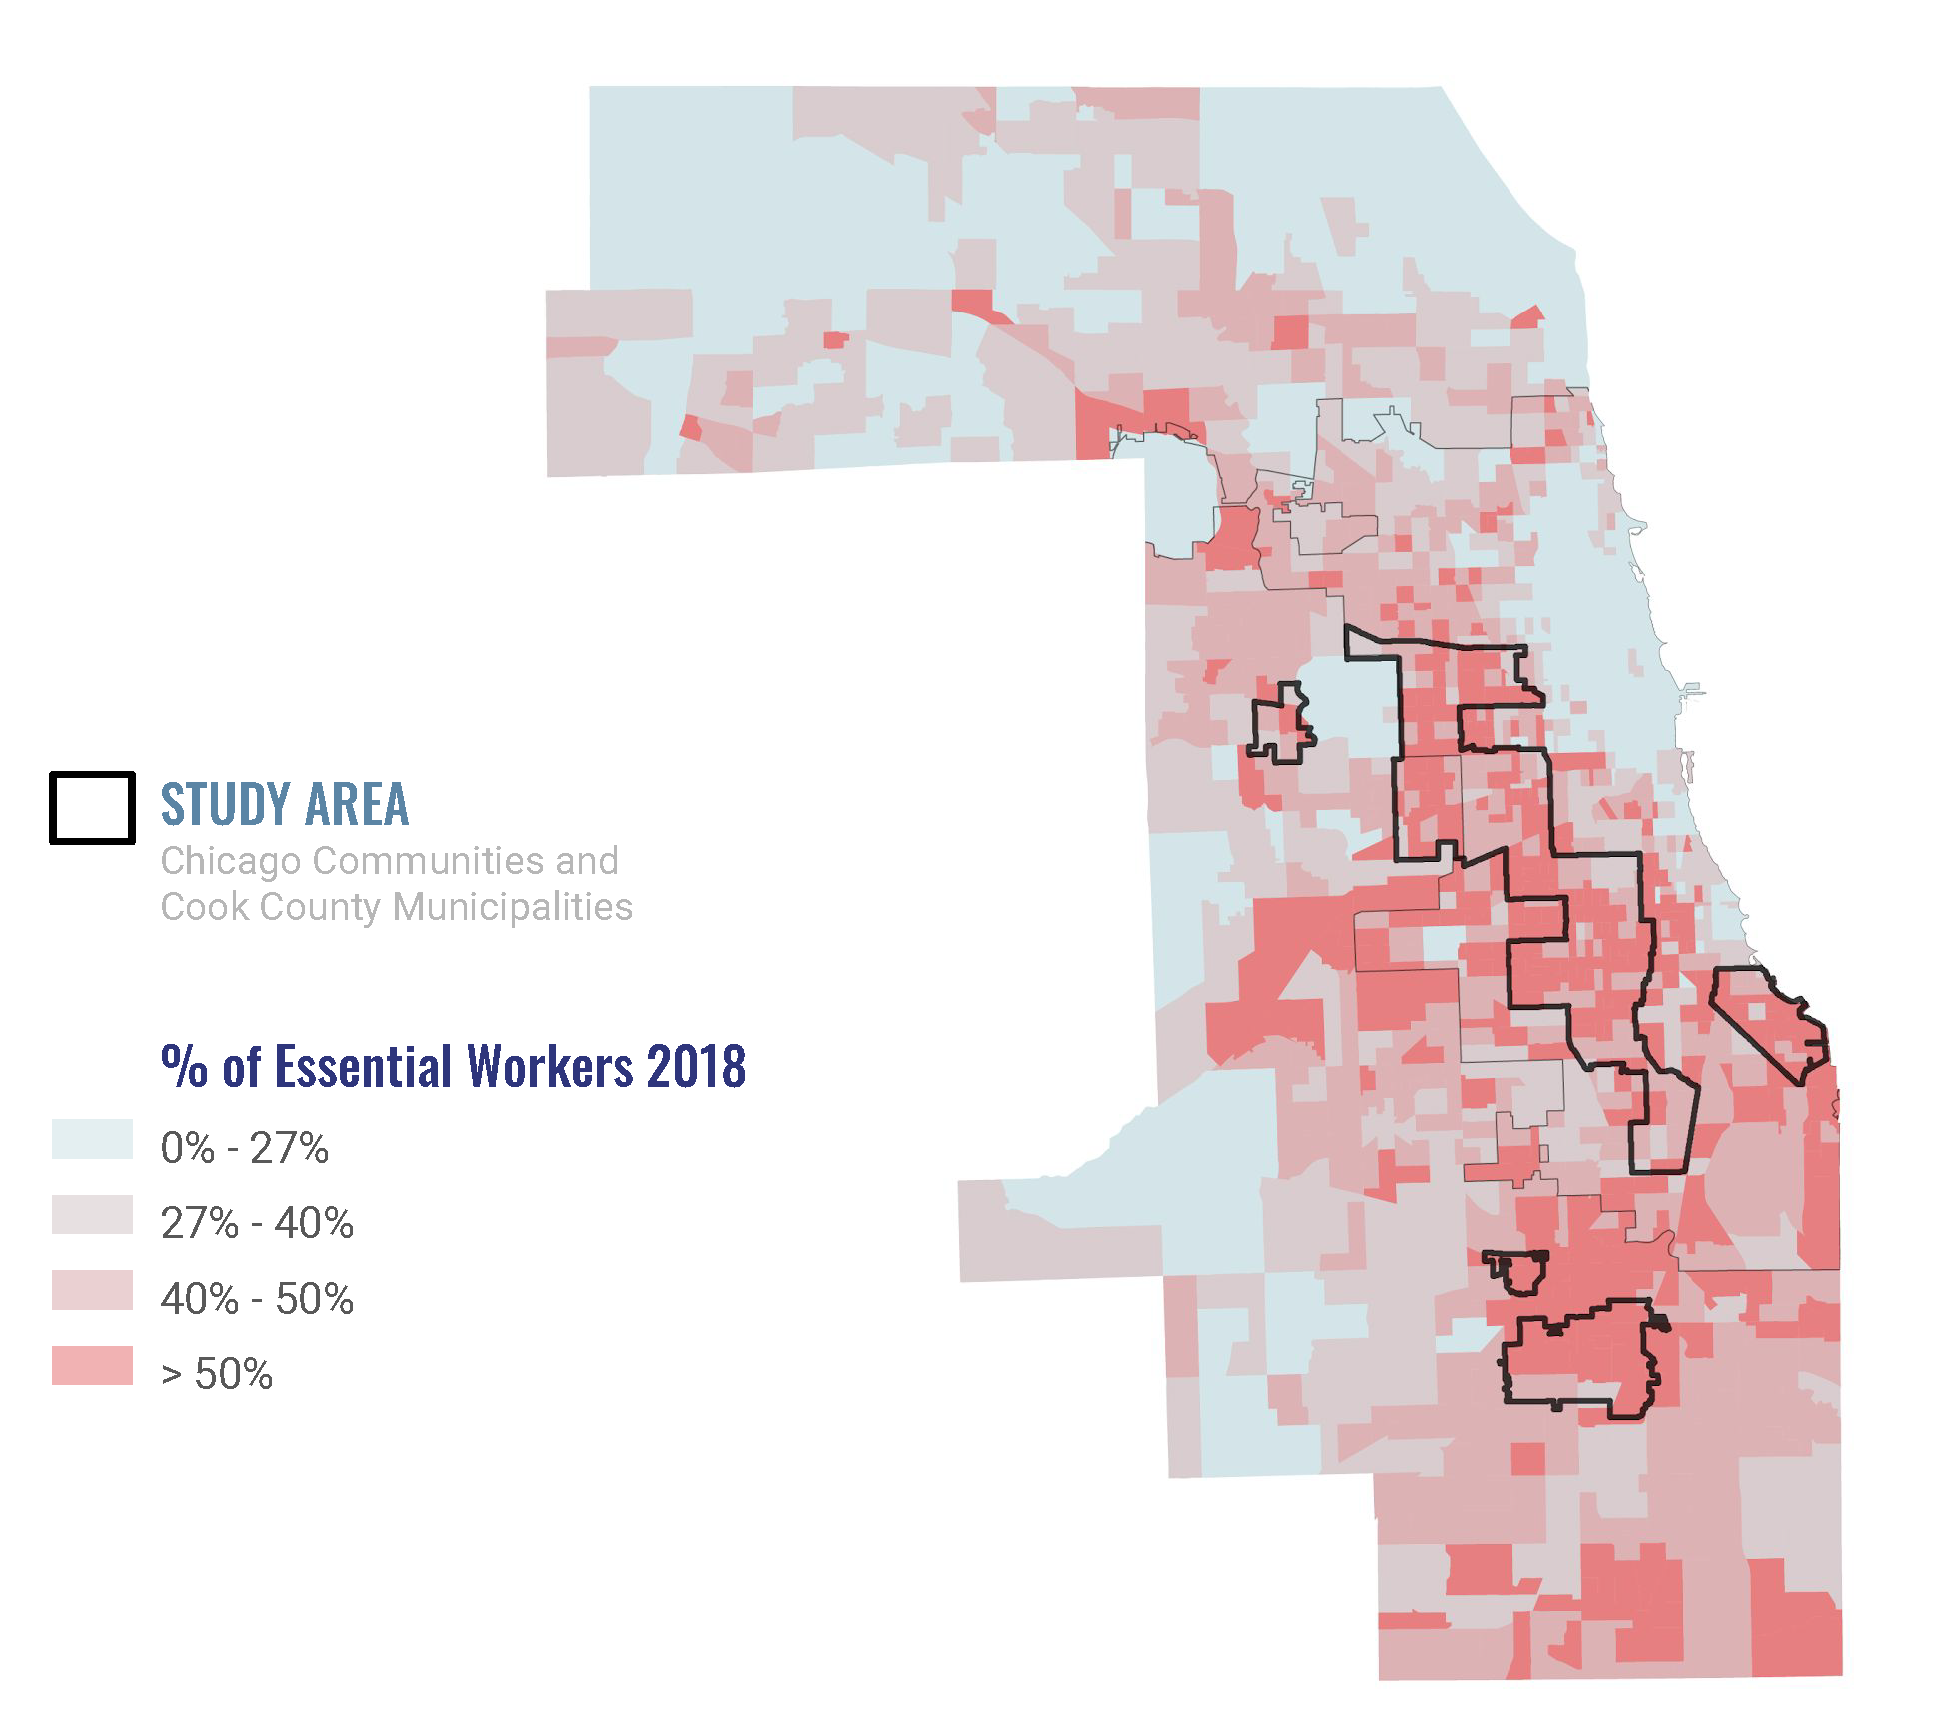
Essential Workers Disproportionately Black and Latinx

Communities where Essential Workers Live Have Higher Rates of Uninsured Residents

Essential Workers Have the Added Burden to Travel the Most Far for Pharmacies

Unequal Distribution of Stores Throughout the City

Disparate Access to Health Care

Disparate Access to Mental Health Care
03
GOVERNMENT FUNDING
The way we distribute precious few resources does not often address these structural problems in the most equitable manner. When we distribute resources just based on population (as was the case with PPP funds) we are simply distributing it equally, not directing it to where it is needed most, but to everyone, including those who don’t need it.
But we have a choice to distribute resources more equitably, as in the case of the Cook County CARES Act, where funds were distributed based on factors such as a municipalities’ rate of poverty, rather than just population.
↓

Payment Protection Program (PPP) Loans

Suburban Cook County CARES Act Grants by Dollars

Access to Stimulus Checks

Small Business Relief Funds by Zip Code: City of Chicago

Micro-business Recovery Grant Applications by Community Area: City of Chicago
04
PRIVATE SECTOR FUNDING
Of the limited data that has been gathered in aggregate, about nine percent of local companies' employee base comes from our study area. There are no corporate headquarters on the South and West Sides of Chicago, and companies send more volunteers than infrastructure investments to these areas.
05
PHILANTHROPY
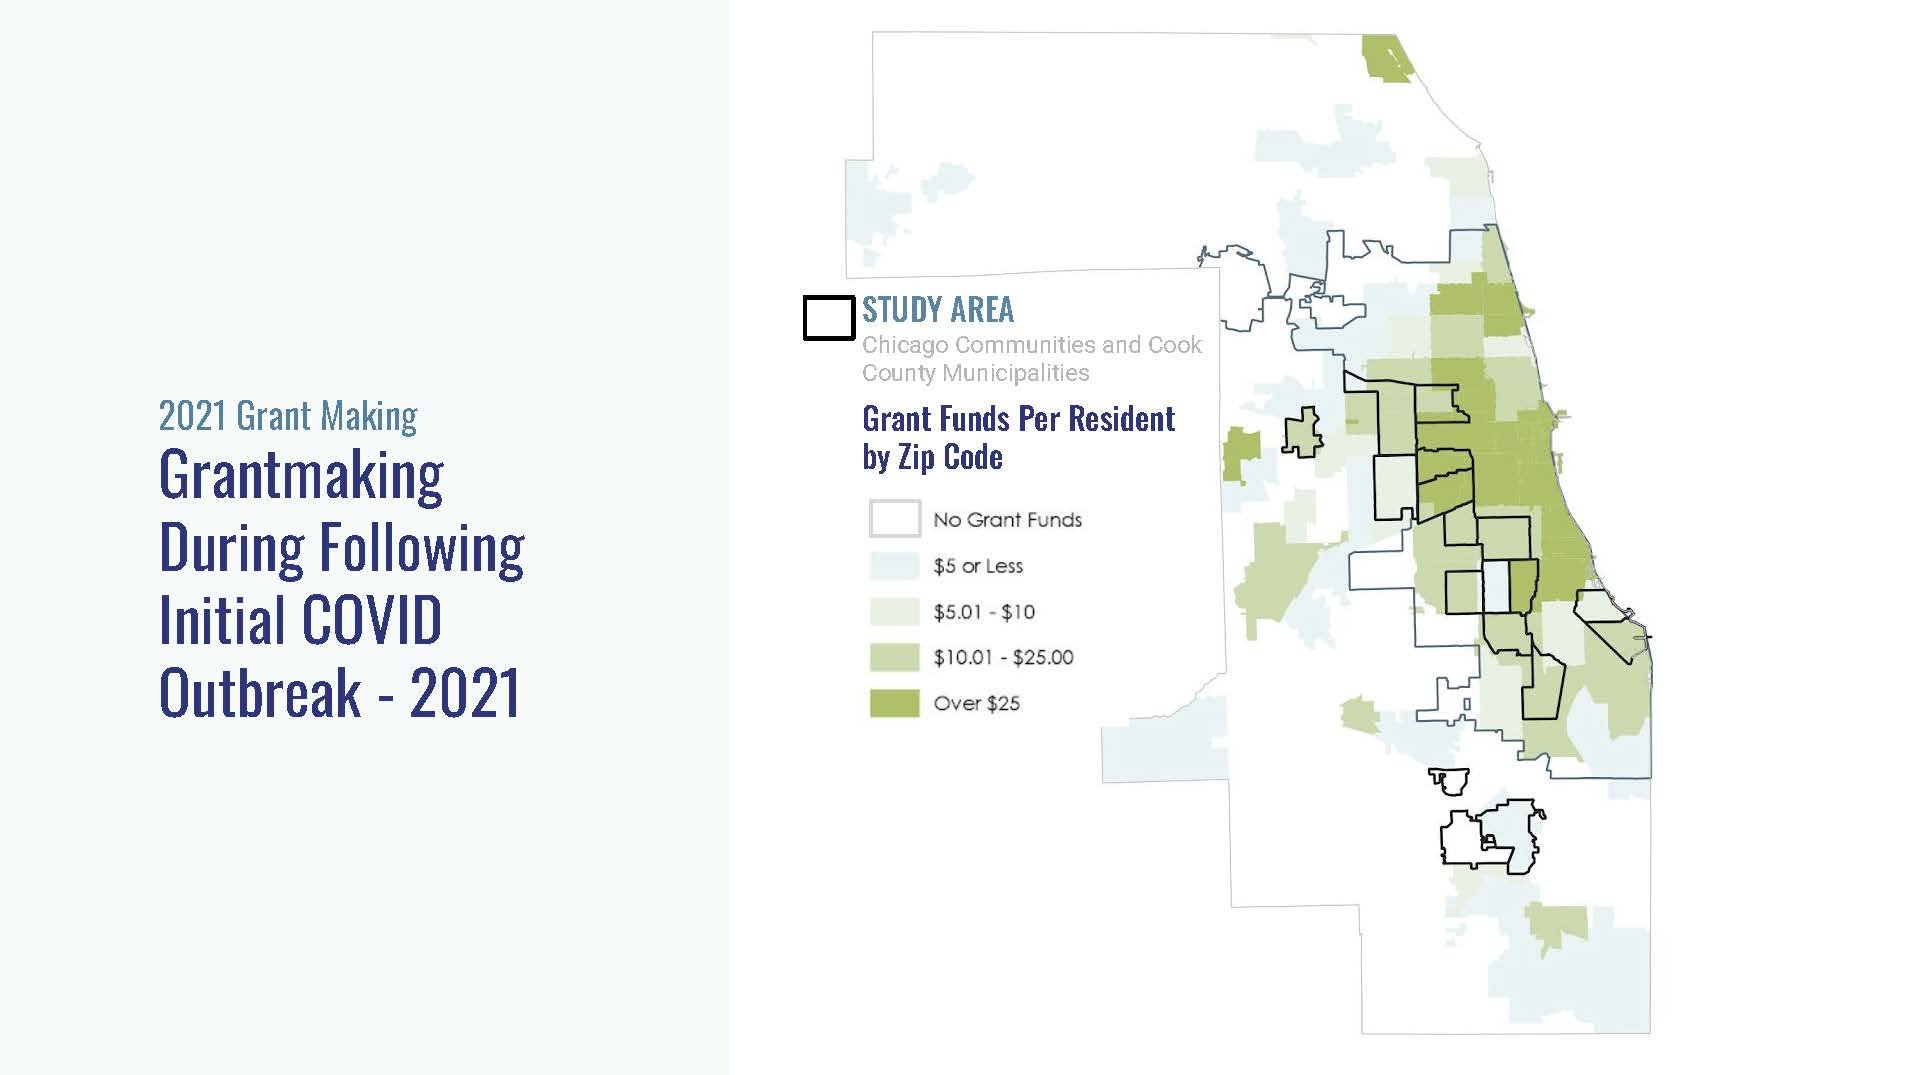
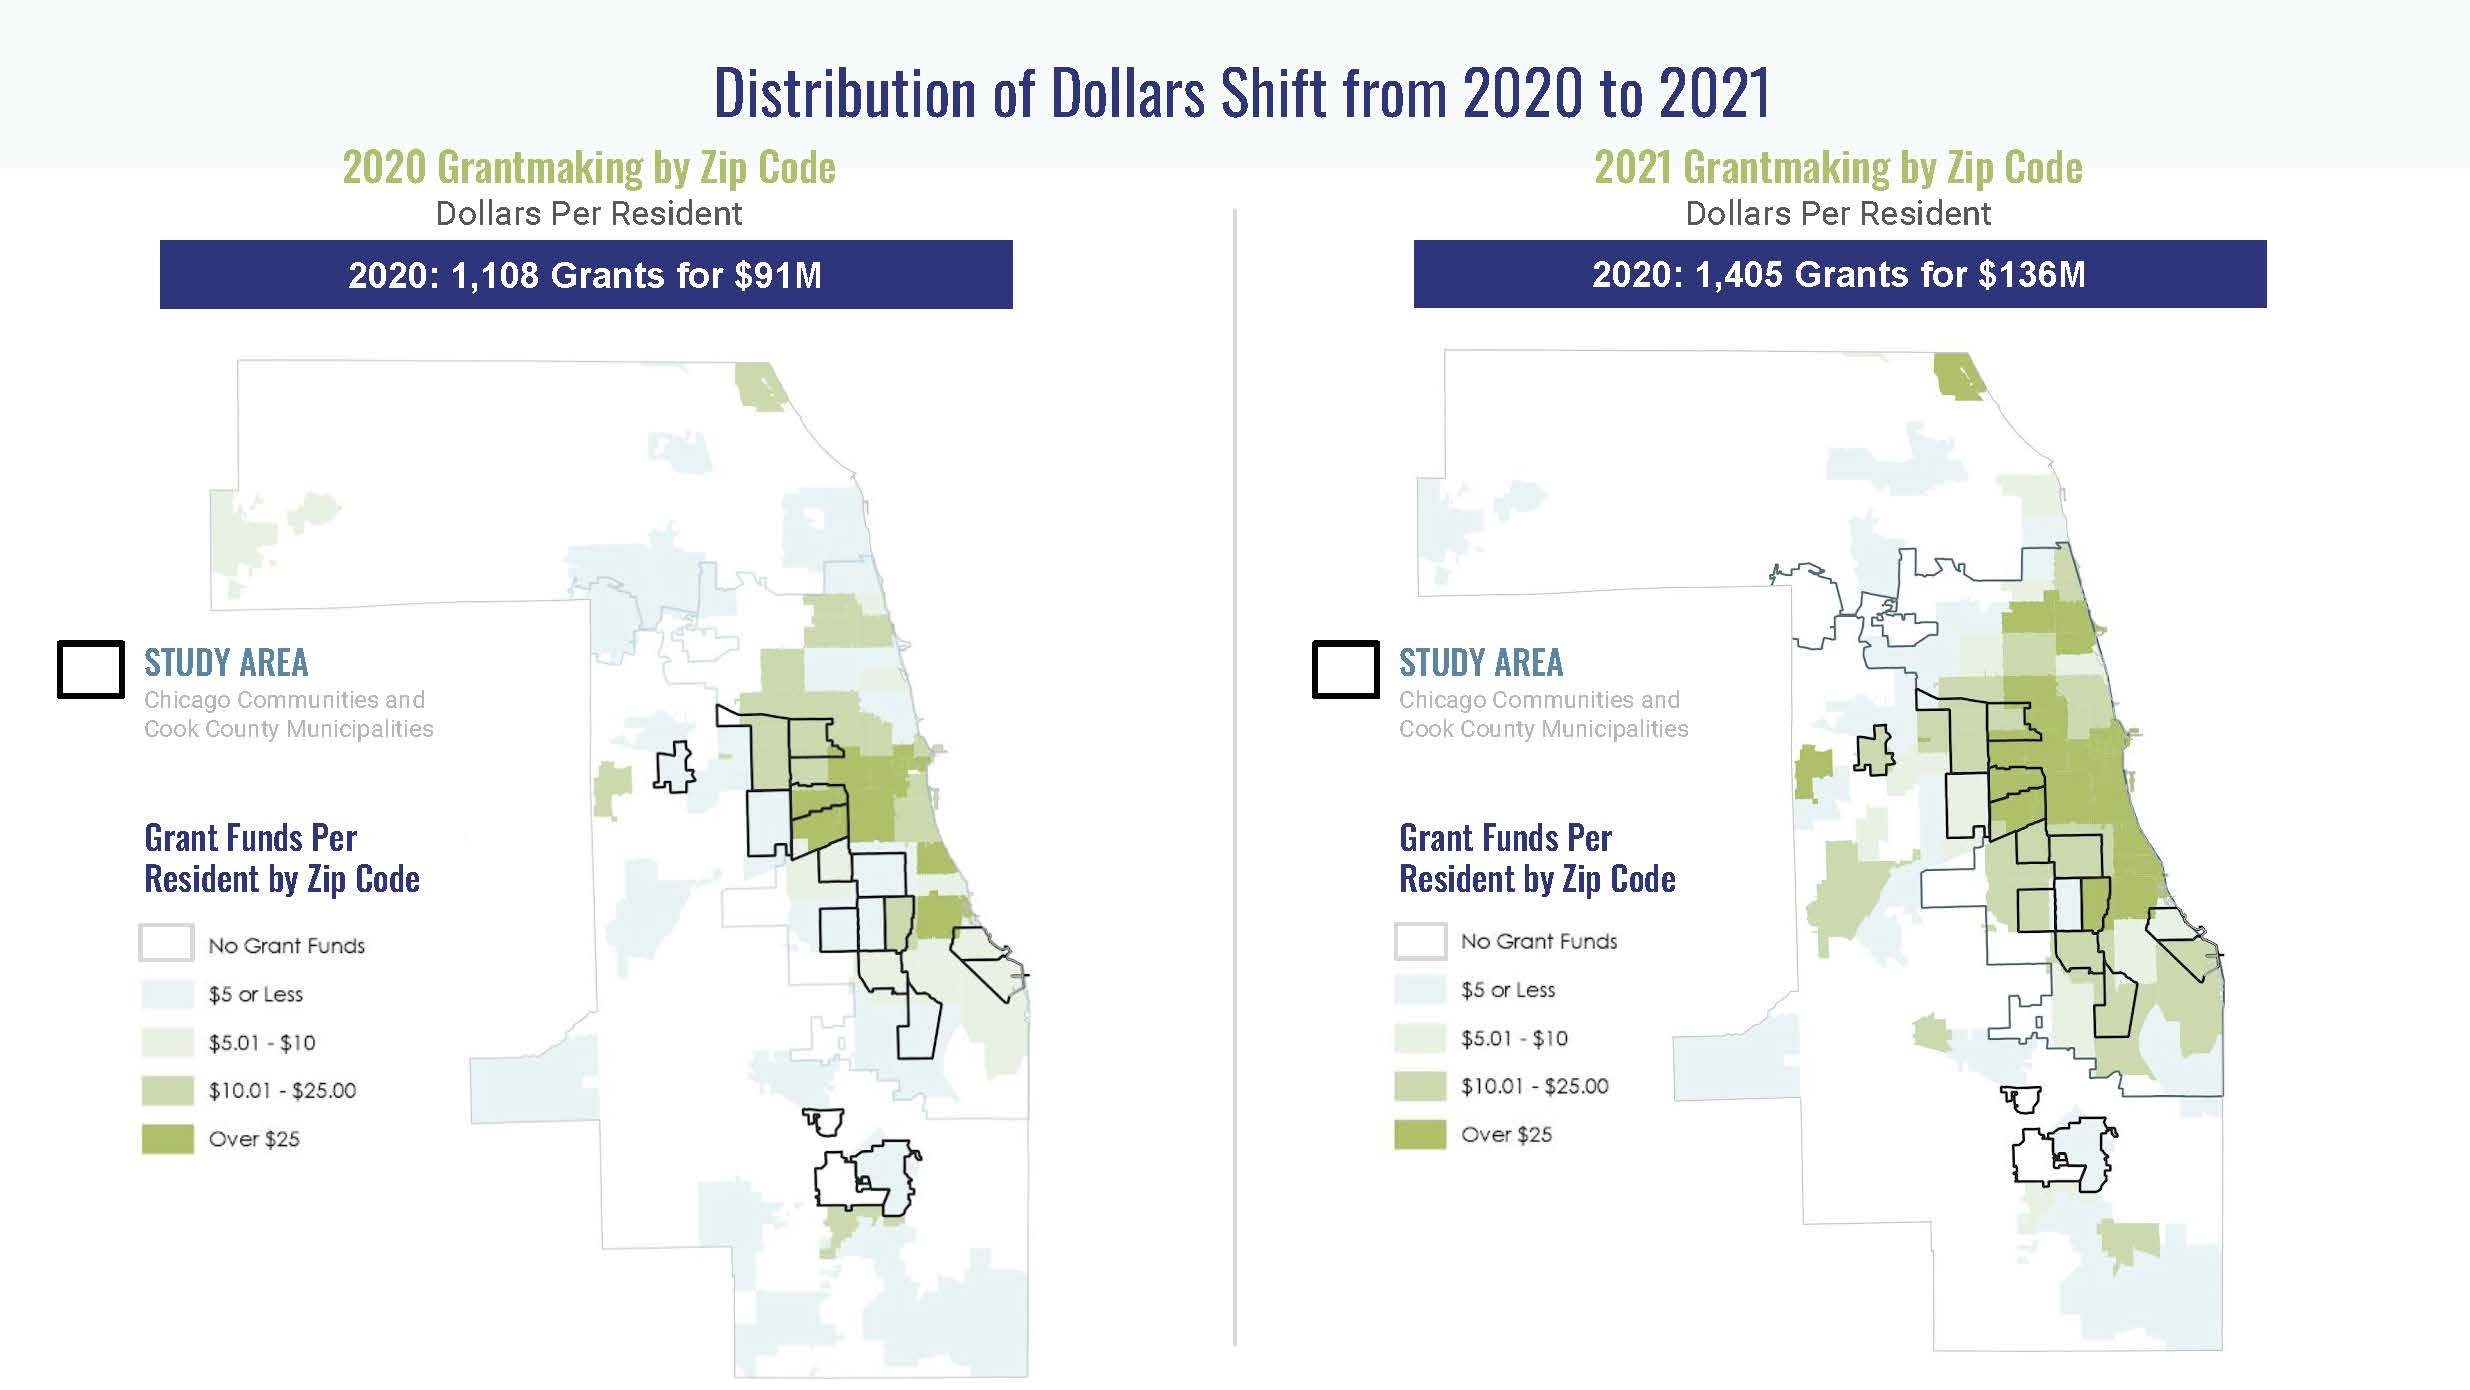
In the year that preceded the COVID pandemic, we noted that very few dollars had gone to those in the study area, with all the issues we already surfaced. This follows historic philanthropic patterns. But the COVID shift was swift and tremendous shortly after the pandemic hit.
During this crisis funders came together, created robust funds, shifted application practice to make it easier, changed criteria to seek out BIPOC-led organizations and gave so much more in three months than in the previous year. These are the choices that public, private, and philanthropic entities can make in choosing to dismantle the tinderbox that historical structural racism created.
↓

(MAR 2018 - FEB 2020) Grants Made One Year Prior to COVID-19

(MAR 2020 - JUL 2020) Grantmaking During COVID-19 Shift
06
2022 Updated Data
COVID remained a funding priority in CY20-21
Four of the respondents reported have a specific funding stream to support Covid relief and recovery
Half have a specific funding stream to support racial justice, while two additional respondents considering how their assets can be used to support economic recovery and racial justice
Half of the respondents noted the use of demographic data on leadership/board to inform decision making; the remaining organizations said this practice was still under development
↓


Interested in learning more?
Find links to articles and reports here.
Download the presentation to see our data sources.

Thank you for joining us in this effort.
The maps created by this partnership can be downloaded and are meant to be shared widely and is available for public use. Sign up with your name and email to access the presentation slides with speaker notes.